2026 Top Solar Project Trends for Global Buyers

Global solar procurement is entering a more demanding phase in 2026. Buyers are no longer comparing panels alone. They are assessing complete solar project value, delivery certainty, grid access, storage readiness, and long-term financial resilience.

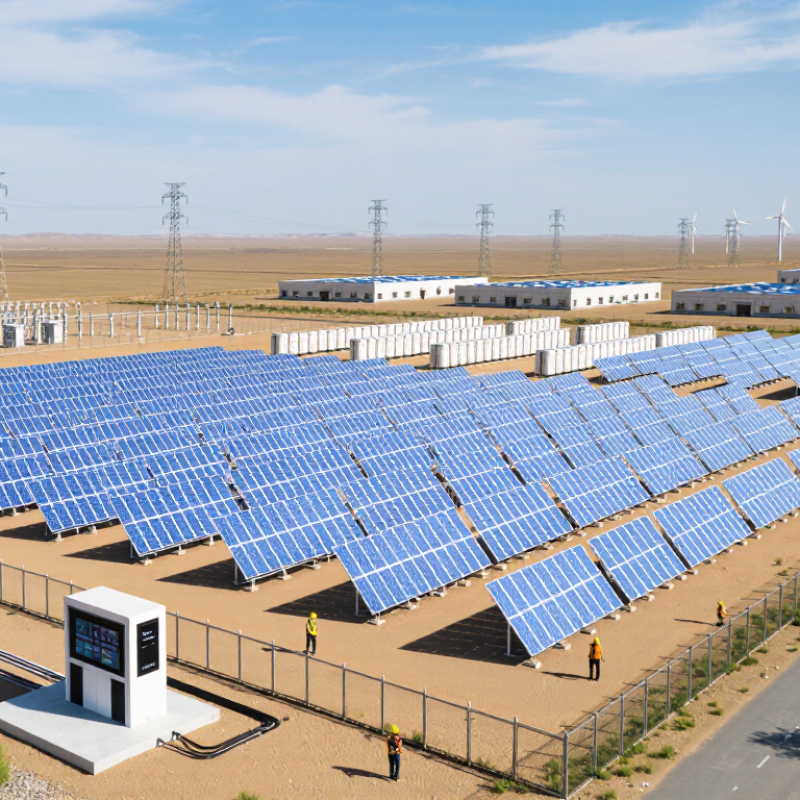
Fatih Birol, Executive Director of the International Energy Agency, said, “Solar is going to be the new king of electricity markets.” That prediction is becoming visible in utility-scale fields, commercial rooftops, and hybrid projects worldwide. Trackers now follow the sun across dry plains. Batteries respond when evening demand rises. Digital monitoring platforms identify weak strings before they become expensive failures.

Yet growth does not guarantee success. Module prices may remain competitive, while transformers, land, and interconnection capacity create delays. Buyers must examine degradation warranties, EPC experience, local service teams, and realistic construction schedules. A low bid can hide costly assumptions. That matters.

The strongest 2026 solar project strategies will connect technology choices with local conditions. Desert sites require dust management and water-conscious cleaning. Tropical projects need corrosion protection and storm planning. Emerging markets may need flexible financing and stronger community engagement. These details are easy to underestimate.

Some forecasts still appear too confident. Weather changes, policy revisions, and supply disruptions can reshape project economics quickly. Careful buyers should test several scenarios before signing. Experience suggests that dependable execution often matters more than impressive capacity figures. The next generation of global solar projects will be judged by what they deliver after commissioning, not only by what they promise on paper.

2026 Top Solar Project Trends for Global Buyers

Global Solar Project Market Overview and Key Growth Drivers

Global solar project demand is entering 2026 with strong momentum. The International Renewable Energy Agency reported 1,865 GW of global solar capacity by the end of 2024. Solar added about 452 GW that year, representing most new renewable capacity. Asia remained the largest regional market, while Europe, the Middle East, Africa, and Latin America expanded utility-scale and distributed projects.

Cost is only one growth driver. The International Energy Agency expects renewable capacity to grow by nearly 5,500 GW between 2024 and 2030, with solar PV providing most additions. Lower equipment prices, improved project finance, and supportive auctions are accelerating procurement. Buyers are also requesting battery storage, forecasting systems, and flexible inverters. These features help manage evening demand and reduce grid congestion.

The details matter. A serious buyer should review irradiance records, land rights, interconnection studies, degradation assumptions, and local permitting timelines. One overlooked substation can delay a project for months. Supply-chain transparency is also becoming important, especially for traceability and responsible sourcing. Forecasts are not promises. Some markets still face curtailment, weak transmission, and changing subsidy rules. The best 2026 projects will balance attractive generation estimates with conservative financial models, verified construction experience, and clear long-term operations plans.

Leading Solar Technologies Shaping Projects in 2026

Solar projects in 2026 are moving beyond simple module replacement. Buyers are comparing energy yield, land use, durability, and long-term service requirements.

Bifacial modules are gaining attention in projects with bright ground surfaces. They can capture reflected light from both sides. Single-axis trackers may increase output, but their value depends on wind, soil, and maintenance conditions. In hot climates, n-type cell designs can reduce performance losses. Yet higher efficiency does not automatically mean better returns. A poorly matched mounting system can erase the expected advantage.

Tandem perovskite-silicon cells are attracting serious research interest. Their wider light absorption could improve output from limited land. Commercial reliability remains an open question. Buyers should examine independent testing, degradation data, and warranty terms carefully. Floating solar is also expanding where reservoirs offer stable water surfaces. It saves land, but anchors, corrosion, and ecosystem monitoring require more engineering attention.

Storage is becoming a core project technology, not an optional add-on. Lithium-based systems remain common, while alternative chemistries may suit longer-duration needs. Advanced inverters can support voltage stability and grid-forming functions during disturbances. Digital monitoring helps identify underperforming strings, thermal hotspots, and tracker faults before losses become expensive. Still, software predictions can be wrong when sensors drift or weather data is incomplete. Experienced buyers should request field evidence, transparent assumptions, and repair plans that work beyond the first operating year.

Regional Solar Development Trends for Global Buyers

2026 Top Solar Project Trends for Global Buyers

Regional Solar Development Trends for Global Buyers

Solar development in 2026 will vary sharply by region, grid capacity, land access, and financing conditions. European buyers are prioritizing rooftop systems, battery storage, and repowering older sites. Grid queues remain a practical concern, even when sunlight is plentiful.

The Middle East and North Africa continue to attract large utility-scale projects. Strong solar radiation supports competitive generation, but water use, dust, and transmission planning require careful assessment. South Asia shows rising demand for distributed solar, especially near factories and agricultural facilities. In Southeast Asia, island geography makes hybrid solar and storage systems increasingly useful.

Latin American markets offer excellent irradiation and growing electricity demand. However, currency exposure and permitting delays can change project returns quickly. African projects often need stronger local grid studies and realistic maintenance plans. A regional forecast can still be wrong.

Tips: Compare solar resource data with hourly grid conditions. Request land, permitting, and interconnection evidence before signing. Review battery degradation assumptions, local tax rules, currency risks, and supplier lead times. Visit the proposed site when possible. A satellite image is not enough. Use independent technical and legal reviews, especially where project data appears unusually optimistic. Procurement teams should also check module warranties, recycling obligations, and workforce availability. Small gaps in regional knowledge may become expensive construction delays.

2026 Top Solar Project Trends for Global Buyers

Regional Solar Development Trends for Global Buyers

Asia remains the dominant solar development region, while Europe and North America continue to provide significant opportunities for utility-scale, commercial, and distributed solar projects. Emerging markets in South America, Africa, the Middle East, and Oceania offer long-term growth potential supported by rising electricity demand and expanding renewable-energy policies.

Data shown as rounded regional shares of global solar PV capacity additions in 2023, based on international renewable-capacity statistics.

Project Economics, Financing, and Procurement Considerations

For global solar buyers, 2026 project economics will depend on more than module prices. IRENA’s Renewable Power Generation Costs in 2023 reported a 12% annual decline in utility-scale solar costs. Its global weighted-average LCOE reached about USD 0.044 per kWh. However, land, grid upgrades, insurance, and curtailment can quickly weaken that advantage. A low tariff is not automatically a low-cost project.

Financing teams will examine revenue quality, currency exposure, and construction risk more closely. The International Energy Agency estimated global clean-energy investment would reach USD 2 trillion in 2024, with solar attracting roughly USD 500 billion. Buyers should test debt-service coverage under lower generation, delayed commissioning, and higher interest rates. Small assumptions matter. Our spreadsheets often look precise, while grid queues remain uncertain.

Procurement should connect price with measurable performance. Contract terms need clear delivery dates, degradation limits, replacement duties, and liquidated damages. Independent factory inspections can reduce quality surprises, especially for projects using multiple suppliers. The IEA expects solar and wind to provide about 95% of new renewable capacity through 2030. This scale may improve purchasing power, but it can also pressure factories and logistics networks. A cheaper component may create higher lifecycle costs if warranties are difficult to enforce. Deliberate contingency budgets are still sensible.

2026 Top Solar Project Trends for Global Buyers - Project Economics, Financing, and Procurement Considerations
Trend / Topic Indicative 2026 Benchmark Project Economics Impact Financing Consideration Procurement Consideration Buyer Action
Utility-scale solar capital cost Approximately US$650–950 per kWdc for utility-scale PV, excluding land, financing, and major transmission upgrades. Lower installed cost can support a levelized cost of electricity of roughly US$0.03–0.10 per kWh, depending on irradiation, financing, taxes, and grid costs. Debt sizing is more sensitive to tariff certainty and grid-delivery risk than to module price alone. Compare total installed cost rather than equipment price; include freight, duties, construction, warranties, spares, and commissioning. Request a full cost breakdown using a common US$/kWdc basis and clearly defined exclusions.
Higher-efficiency module deployment Commercial module efficiency commonly falls within approximately 21%–24%, with higher-efficiency products available for land-constrained sites. Higher efficiency reduces land, racking, cable, and labor requirements per MW, but may not minimize total cost where land is inexpensive. Lenders generally focus on independently verified energy yield, degradation, and warranty enforceability rather than nameplate efficiency alone. Specify minimum power tolerance, temperature coefficient, degradation profile, testing standards, and replacement obligations. Select technology based on lifetime energy per usable acre or hectare, not only on module wattage.
Single-axis tracking and bifacial generation Tracking can increase annual generation by approximately 10%–25% versus fixed-tilt systems; bifacial gain is commonly about 3%–10%, subject to site conditions. Additional energy can reduce the levelized cost of electricity, but benefits depend on albedo, row spacing, wind conditions, terrain, and maintenance access. Independent engineers should validate the production uplift and assess mechanical availability and extreme-weather exposure. Require site-specific yield modeling, tracker availability guarantees, spare-part plans, and wind-stow performance requirements. Use tracking where the incremental energy value exceeds added civil, mechanical, and operating complexity.
Solar-plus-storage projects Front-of-meter batteries are commonly evaluated at 2–4 hours of duration, with planning-level installed costs of approximately US$250–500 per kWh depending on location and configuration. Storage can increase dispatch value, reduce curtailment, and shift output to peak periods, but adds augmentation, replacement, efficiency, and fire-safety costs. Debt models should include round-trip efficiency, usable capacity, degradation, augmentation reserves, and revenue-stacking restrictions. Define battery capacity guarantees, operating limits, thermal management, safety testing, recycling, and long-term service obligations. Evaluate storage using an hourly dispatch model rather than a simple percentage uplift to annual solar output.
Capacity factor and resource quality Typical utility-scale PV capacity factors are approximately 18%–30% for fixed-tilt systems and 22%–35% for tracking systems, depending on solar resource and losses. A 1-percentage-point change in capacity factor can materially affect revenue, debt capacity, and levelized cost over a 25–35-year asset life. Use P50, P90, and downside cases; lenders frequently size debt against conservative production scenarios. Require at least one year of on-site measurements where feasible and validate satellite data, soiling, snow, temperature, and availability assumptions. Rank sites by net delivered energy and grid value, not by irradiation alone.
PPA structure and merchant exposure Long-term power purchase agreements commonly run for approximately 10–25 years; shorter contracts increase exposure to refinancing and market-price risk. Fixed-price contracts improve revenue visibility, while indexed or merchant structures may provide upside but introduce price, basis, and volume risk. Contracted revenue generally supports higher leverage than fully merchant revenue, subject to counterparty credit and termination provisions. Align delivery obligations with realistic generation profiles and define curtailment, force majeure, change-in-law, and imbalance rules. Stress-test fixed-price, indexed, merchant, and hybrid revenue cases before selecting the procurement route.
Debt terms and coverage requirements Project debt tenors commonly range from approximately 10–20 years, with minimum debt-service coverage ratios often around 1.20x–1.40x depending on risk allocation. Longer tenor can reduce the required tariff but may increase refinancing, interest-rate, and reserve-account requirements. Debt sizing should reflect P90 energy, curtailment, degradation, operating costs, taxes, and any merchant tail after the contracted period. Preserve lender step-in rights, direct agreements, performance security, and assignment rights in supply and construction contracts. Obtain financing term sheets early so technical specifications match bankability requirements.
Degradation and lifetime performance Planning assumptions commonly use approximately 0.3%–0.5% annual module degradation, subject to technology, climate, and warranty terms. A difference of 0.2 percentage points in annual degradation can materially affect lifetime energy and project valuation. Independent engineers should reconcile manufacturer warranties with modeled degradation and establish conservative reserve assumptions. Specify annual degradation limits, minimum power at key warranty years, claims procedures, testing rights, and remedies for underperformance. Compare lifetime delivered MWh rather than first-year output or nominal module power.
Grid congestion and curtailment Project-level curtailment can range from below 2% to above 15% in constrained markets; the actual value is highly location-specific. Curtailment reduces sellable energy and can raise the effective levelized cost even when solar resource and equipment costs are attractive. Lenders may apply revenue haircuts or require curtailment compensation, firm transmission rights, or additional storage. Verify interconnection studies, queue position, network-upgrade responsibilities, outage rules, and dispatch priority. Treat grid deliverability as a primary investment criterion, not a late-stage permitting task.
Interconnection and construction schedule Large-project interconnection timelines can extend approximately 18–48 months, while construction commonly requires about 9–18 months after permits and equipment are secured. Schedule delays increase development spend, financing carry, liquidated damages, and the risk of losing an incentive or contracted commercial operation date. Financial close typically depends on executed interconnection agreements, permits, land rights, and a credible completion schedule. Use milestone-based contracts with completion tests, delay damages, change-order controls, and clear responsibility for grid upgrades. Secure grid capacity and critical-path permits before placing non-cancellable equipment orders.
Supply-chain resilience and delivery risk Typical procurement lead times may range from approximately 4–12 months for modules and inverters, with longer periods possible for transformers, switchgear, and grid equipment. Delivery delays can defer revenue and trigger liquidated damages; low equipment prices may be outweighed by logistics, tariff, or replacement costs. Financiers increasingly review traceability, sanctions exposure, country risk, warranty continuity, and availability of replacement equipment. Include approved-equivalent provisions, dual-source options, inspection rights, shipment milestones, title transfer, and secure payment terms. Build a documented supply-chain risk register and maintain contingency plans for critical electrical equipment.
Operations, maintenance, and availability Well-operated utility-scale PV projects commonly target technical availability of approximately 98%–99%, excluding grid outages and force majeure events. Small availability losses compound with soiling, clipping, degradation, and curtailment, reducing annual cash flow. Debt models should separate equipment availability from grid availability and include realistic operating-cost escalation and major-component reserves. Define availability formulas, response times, preventive-maintenance windows, spare inventories, cybersecurity controls, and reporting obligations. Evaluate the complete life-cycle service cost over 20–30 years rather than selecting the lowest initial service fee.
Sustainability, compliance, and end-of-life planning Projects are increasingly assessed against environmental, labor, traceability, recycling, land-use, and community-impact requirements in addition to price and output. Compliance costs may increase development expenditure but can reduce permitting, reputational, financing, and resale risks. Lenders may require environmental and social action plans, supply-chain due diligence, decommissioning reserves, and measurable reporting. Include material traceability, labor standards, waste handling, recycling, data disclosure, and decommissioning obligations in tender documents. Score bids on risk-adjusted lifetime value, including compliance and end-of-life liabilities.
Note: All figures are planning-level global ranges for preliminary buyer comparison. Actual values vary by country, site conditions, project scale, currency, tax regime, labor costs, grid connection, contract structure, and financing market. Final investment decisions should use independent engineering, legal, tax, insurance, and financial analysis.

Sustainability, Regulation, and Risk Management in Solar Projects

Global solar procurement is entering 2026 with larger pipelines and tighter scrutiny. IRENA reported 345 gigawatts of new solar capacity in 2023, representing about 73% of renewable additions. The scale is impressive. However, buyers now need more than attractive module prices. They must examine land conditions, water use, labor practices, waste handling, and local grid capacity before signing contracts.

Regulation is becoming a project variable, not a compliance footnote. The IEA’s Renewables 2024 report expects renewable capacity to expand sharply through 2030, increasing pressure on permitting systems and supply chains. Buyers should request traceable material records, carbon data, and independent environmental assessments. These documents can support due diligence under evolving disclosure and supply-chain rules. Yet reporting quality remains uneven. A polished certificate does not always prove responsible production.

Risk management also requires physical testing. Solar resource studies should include heat, dust, hail, flooding, and wind exposure. The IPCC has identified rising climate hazards that can affect infrastructure reliability and insurance costs. Buyers should stress-test financial models against delayed grid connections, curtailment, currency changes, and extreme weather. No model is perfect. A spreadsheet may still miss a damaged access road after heavy rain. Independent engineering reviews, realistic contingency budgets, and clear contract responsibilities can reduce that blind spot. Sustainability must be measurable at the site, not merely attractive in procurement documents.